
- Home
- About Us
- Industries
- Agritech & Smart Farming
- Aquariums & Zoos
- Art & Cultural Exhibitions
- Automotive & Transportation
- Broadcasting & News
- Construction & Real Estate
- Corporate & Offices
- Cultural Heritage & Preservation
- Cybersecurity Operations
- Digital Content Creation & Media
- E-commerce & Online Retail
- Education
- Energy & Utilities
- Entertainment & Media
- Entertainment Arcades & Amusement
- Environmental Monitoring
- Event Management & Conferences
- Fashion & Apparel Retail
- Fashion Retail & E-commerce
- Finance & Banking
- Financial Trading & Stock Exchanges
- Fitness & Wellness
- Food & Beverage
- Food Processing & Manufacturing
- Gaming, Casinos, & Hospitality
- Government & Public Spaces
- Healthcare
- Hospitality & Event Venues
- Insurance
- Legal & Judicial
- Libraries & Community Centers
- Logistics & Supply Chain
- Luxury Cruise & Maritime
- Manufacturing & Industrial
- Meteorology & Climate Research
- Military & Defense
- Mining & Extraction
- Museums & Cultural Centers
- Non-Profit Organizations
- Oil & Gas Industry
- Professional Training & Development
- Public Health & Awareness
- Public Parks & Recreation Areas
- Public Safety & Law Enforcement
- Public Transportation
- Rehabilitation Centers
- Religious & Worship Spaces
- Renewable Energy
- Retail & Shopping Malls
- Retail Banking
- Security & Surveillance
- Social Media & Digital Marketing
- Sports & Stadiums
- Smart Cities & Urban Planning
- Supply Chain & Inventory
- Television & Film Production
- Travel & Hospitality
- FAQ
- Contact Us
Meteorology & Climate Research
Uses Of Led Display For Meteorology & Climate Research
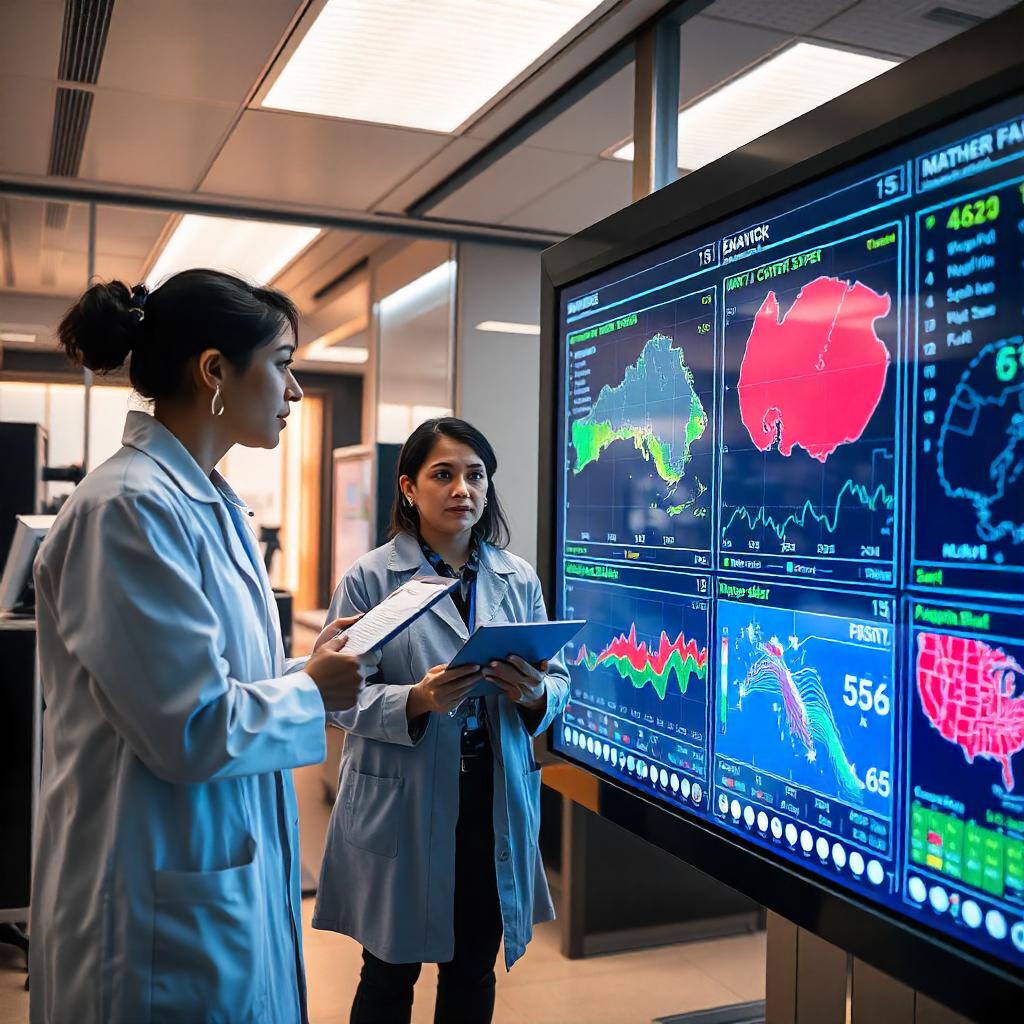
Meteorology and climate research rely on vast amounts of data to monitor weather patterns, track environmental changes, and predict future conditions. Active LED displays have emerged as a powerful tool in these fields, offering researchers, scientists, and meteorologists dynamic ways to visualize complex data in real time. These displays help convey critical information in a clear, easily digestible format, enabling more accurate analysis and better decision-making during extreme weather events or long-term climate studies.
Benefits of Active LED Displays in Meteorology and Climate Research
- Real-Time Data Visualization:
Active LED displays allow meteorologists and climate scientists to present real-time data from weather stations, satellites, and climate models. This ensures that teams can track evolving weather conditions and climate changes as they happen, providing timely insights that support critical decision-making. - Large-Scale Data Monitoring:
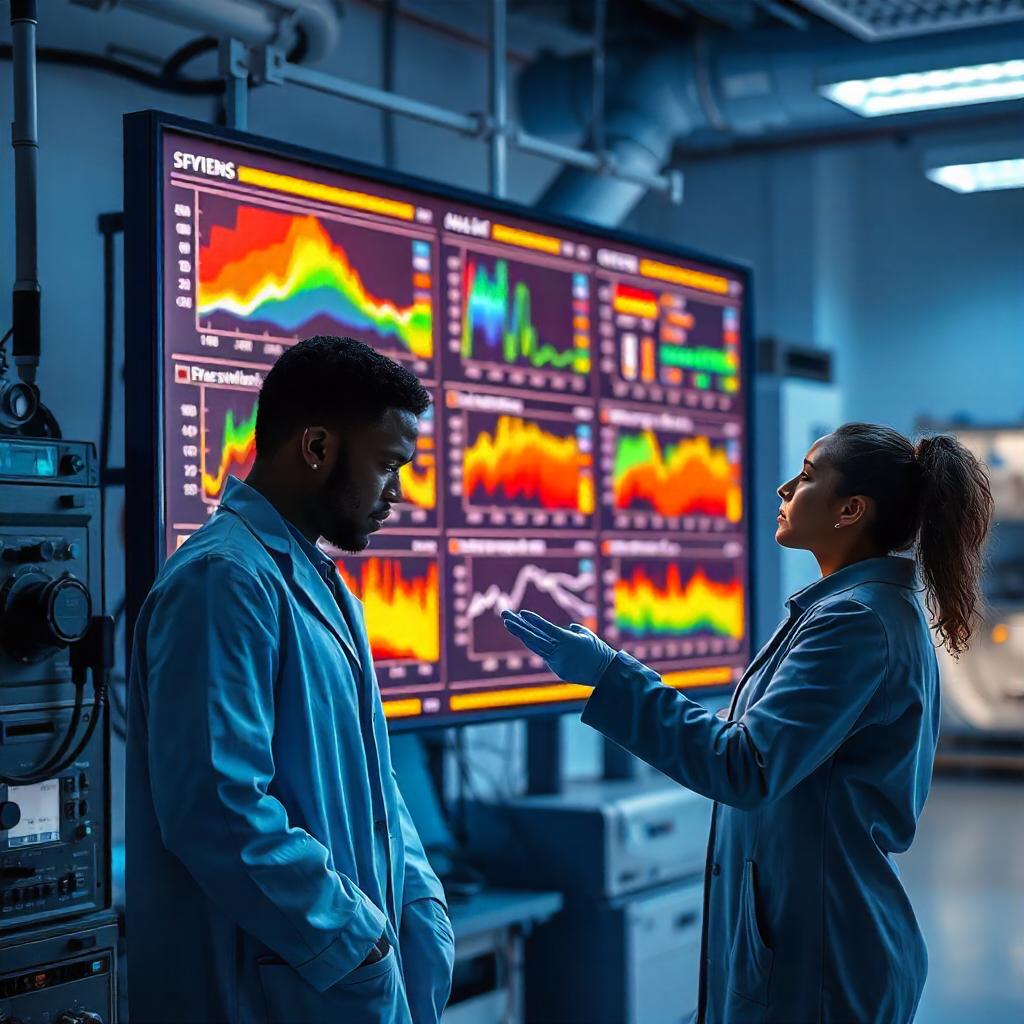
LED displays are ideal for monitoring large datasets and trends. In meteorology and climate research, these displays can show vast amounts of data, including temperature fluctuations, wind patterns, air pressure changes, and satellite imagery, all in a compact and easily readable format. - Enhanced Communication of Complex Data:
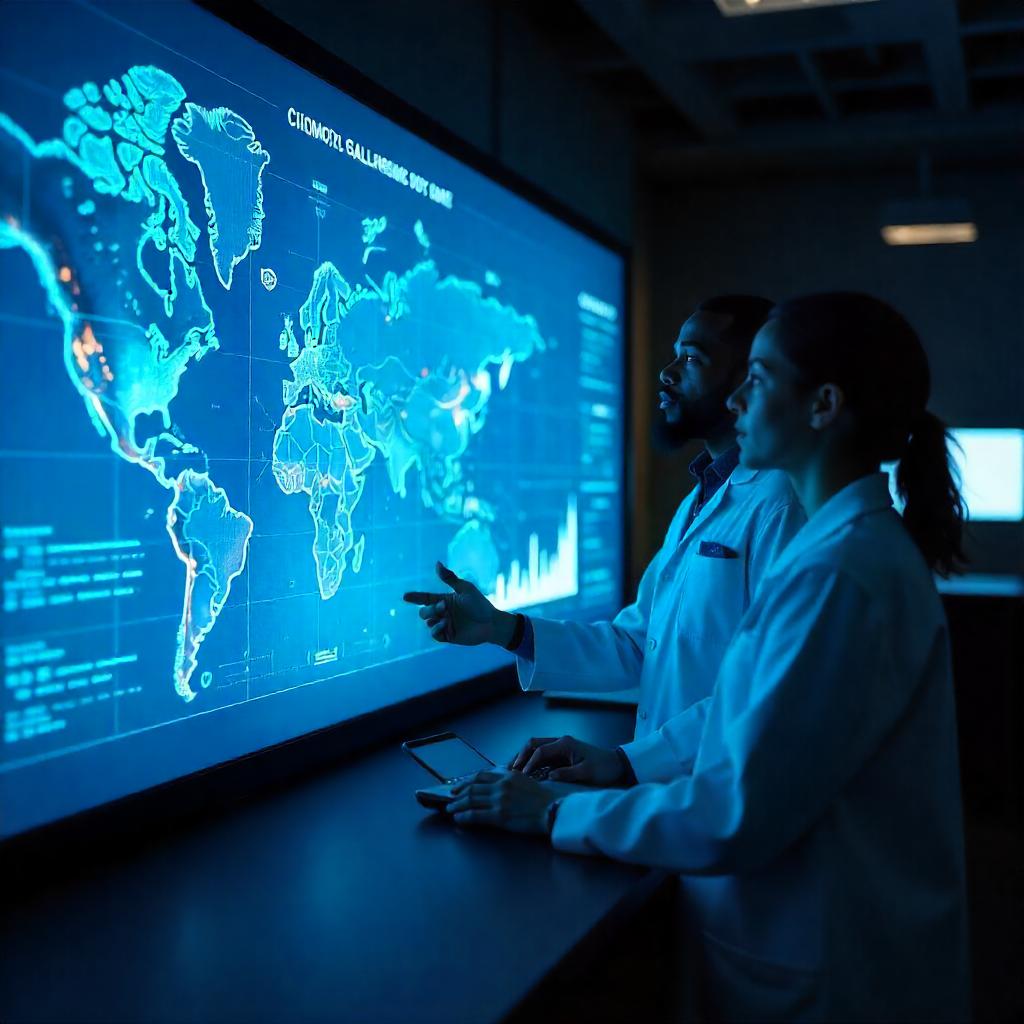
Weather and climate data can be highly complex and difficult to interpret. Active LED displays help simplify this information, using dynamic visualizations such as heat maps, time-lapse animations, and interactive graphs to highlight key trends and patterns in the data. - Collaboration and Awareness:
In research centers, universities, and weather stations, LED displays foster collaboration by providing a shared platform where teams can view and discuss data simultaneously. The visual nature of LED displays promotes more effective communication, ensuring everyone is aligned on the latest developments. - Public Engagement and Education:
Active LED displays can also be used in public settings like visitor centers, museums, and science exhibitions to engage the public with climate data. They can present weather forecasts, real-time climate data, and interactive features that educate the public about meteorology and climate change.
Applications of Active LED Displays in Meteorology and Climate Research
- Weather Forecasting
Purpose: To deliver up-to-date weather forecasts and predictions to meteorologists and the public.
Content Ideas:
- Weather Maps and Animations: Display interactive weather maps with live data showing rainfall, temperature, wind speed, and other conditions across regions.
- Forecast Timelines: Visualize weather forecasts for the coming hours or days, showing expected weather conditions, storm tracking, and extreme events.
- Weather Alerts: Highlight severe weather warnings and emergency alerts, such as tornadoes, hurricanes, or heavy rainfall, in real-time to provide early warnings.
- Climate Change Research
Purpose: To track and display long-term climate data, including global temperature trends and environmental changes.
Content Ideas:
- Climate Models: Display visual simulations of climate models, showcasing predictions about temperature rise, sea-level changes, and other long-term climate impacts.
- Historical Data Comparisons: Visualize historical climate data side by side with current trends, helping researchers and the public understand the trajectory of climate change.
- Carbon Emissions Tracking: Show real-time data on carbon emissions, pollution levels, and environmental health indicators to raise awareness and drive action.
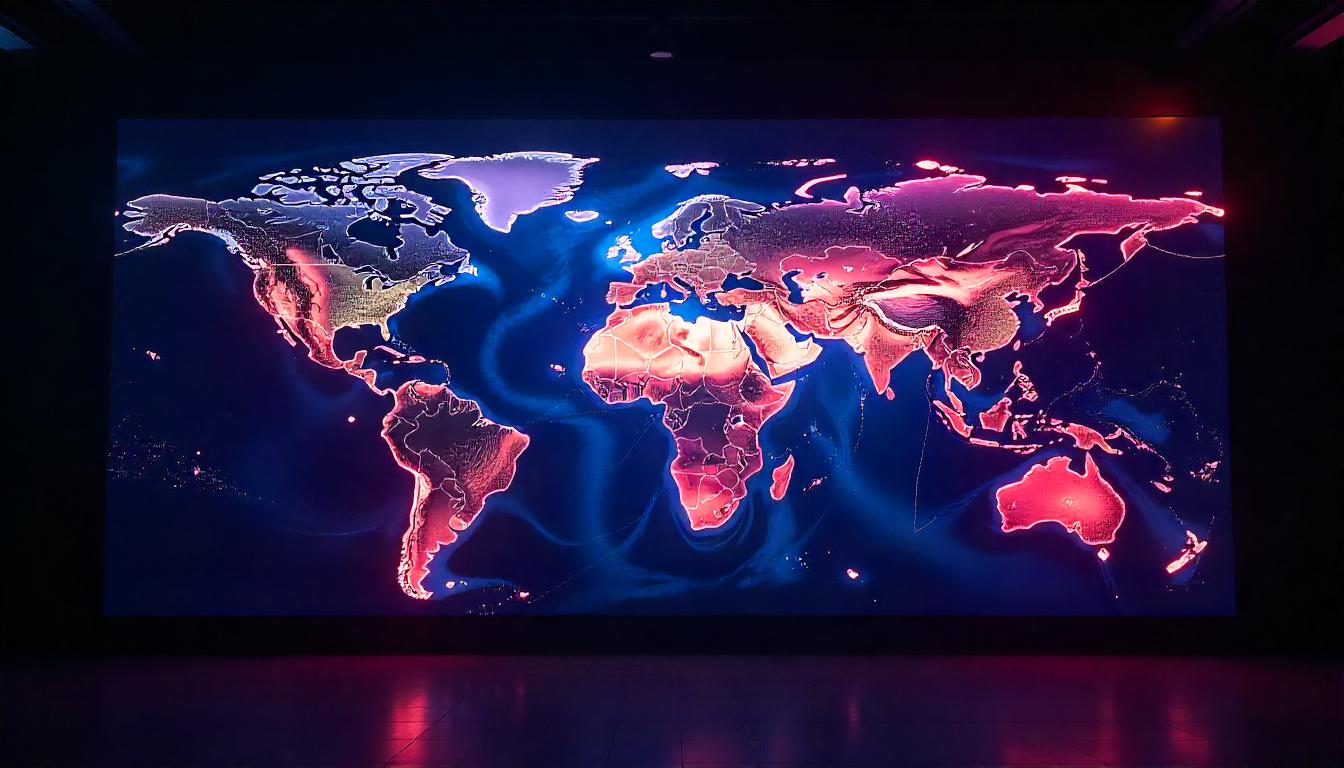
- Satellite and Remote Sensing Data Visualization
Purpose: To display high-resolution satellite images and remote sensing data for weather analysis and environmental monitoring.
Content Ideas:
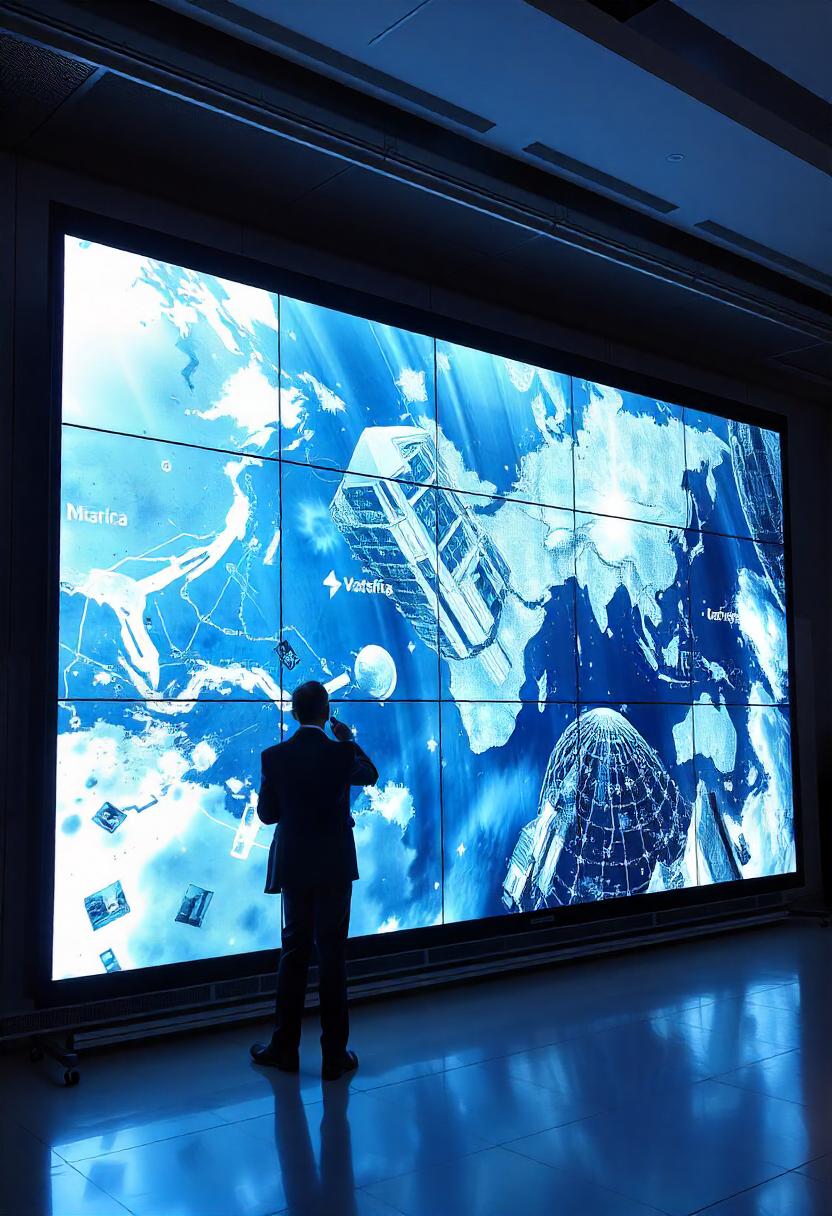
- Satellite Imagery: Use LED displays to show high-definition images from weather satellites, helping researchers track cloud patterns, hurricanes, or other weather phenomena in real-time.
- Air Quality Monitoring: Display air quality indices and pollution levels in real-time, helping to track changes in atmospheric conditions due to human activity or natural events.
- Oceanographic Data: Visualize ocean temperatures, sea levels, and currents to study ocean health and the effects of climate change on marine ecosystems.
- Severe Weather Event Tracking
Purpose: To track and manage real-time data during extreme weather events such as storms, hurricanes, or tornadoes.
Content Ideas:
- Storm Tracking Maps: Show real-time storm movements and predicted paths of hurricanes, tornadoes, or severe thunderstorms.
- Real-Time Data Feeds: Display data from radar systems, weather stations, and drones to monitor severe weather events as they unfold.
- Impact Visualization: Highlight the effects of extreme weather events on communities, including flood predictions, wind damage, and storm surges.
- Public Awareness and Emergency Response
Purpose: To inform the public and emergency response teams about current weather conditions and climate-related risks.
Content Ideas:
- Weather Warnings and Alerts: Display national or regional weather warnings for the public, alerting them about impending severe weather conditions.
- Evacuation Routes and Safety Protocols: In emergency scenarios, display clear maps and instructions for evacuations or safety measures, such as evacuation routes or shelter locations.
- Real-Time Impact Updates: Provide real-time information on the impact of weather events, including power outages, road closures, and other critical infrastructure updates.
- Environmental and Ecological Monitoring
Purpose: To monitor and display data on the health of ecosystems, forests, and wildlife in relation to changing weather patterns and climate conditions.
Content Ideas:
- Forest Fire Tracking: Visualize satellite data and ground-based reports to track forest fires, showing their spread and providing evacuation information.
- Flood Prediction and Monitoring: Display flood maps and hydrological data to help authorities predict flooding risks in real-time and manage resources effectively.
- Biodiversity Monitoring: Track the impact of climate change on local wildlife populations and plant life, displaying trends in migration patterns, breeding seasons, and habitat destruction.
- Research Collaboration and Data Sharing
Purpose: To facilitate collaboration between meteorologists, climate scientists, and environmental researchers.
Content Ideas:
- Multi-Source Data Integration: Use LED displays to integrate data from various sources, such as weather stations, satellites, and climate models, into a single, cohesive visualization.
- Collaborative Research Platforms: Display research progress, key findings, and cross-institutional collaborations to keep teams informed and aligned.
- Data Presentation for Conferences: Present key findings at conferences or public talks with dynamic visualizations, such as climate models, weather forecasts, and environmental data.
Features
- List Item
- List Item
- List Item
- List Item
Advantages
- List Item
- List Item
- List Item
- List Item
Placement Tips for LED Displays in Meteorology and Climate Research
- High-Visibility Locations: Place LED displays in prominent locations such as monitoring stations, research labs, and visitor centers, ensuring they are easily accessible for team members and the public.
- Multi-Screen Setups: Use a multi-screen setup for a comprehensive view of all critical data sources, from weather alerts to environmental statistics. This allows researchers and meteorologists to monitor different data streams simultaneously.
- Interactive Features: Implement interactive displays that allow users to zoom in on specific regions, adjust time frames, or access detailed datasets.
- Large-Scale Public Displays: In science centers, museums, or public spaces, install large LED displays that engage the public with real-time weather data, interactive maps, and climate research findings.
Conclusion
Active LED displays play a crucial role in meteorology and climate research by enabling real-time monitoring, simplifying complex data visualization, and fostering collaboration among researchers. These displays enhance the ability to track weather patterns, monitor environmental changes, and share critical information with both professionals and the public. Whether for forecasting, research, or public engagement, active LED displays provide an effective, dynamic solution to communicate essential climate and weather data. By incorporating them into research centers, meteorology stations, and educational spaces, institutions can improve their capacity to analyze and respond to both short-term weather events and long-term climate trends.
illuminits LED Walls?
Technology
There are three primary LED video wall technologies: ultra-narrow bezel LCD, rear-projection cubes, and direct-view LED displays. Ultra-narrow bezel LCD is the most cost-effective option.
Size
The great thing about illuminits video walls is that they are modular, so you can get them in any size or aspect ratio you want.
Support
The heavier the video wall system becomes, the more panels there are. This puts additional strain on the infrastructure that supports it. illuinits offers the best in-time assistance.
Service
Even high-definition video walls can have problems. This can be a minor or major issue. As a result, Aero provides a variety of comprehensive service packages that ensure minimal downtime at a low cost. Types Of LED Displays